
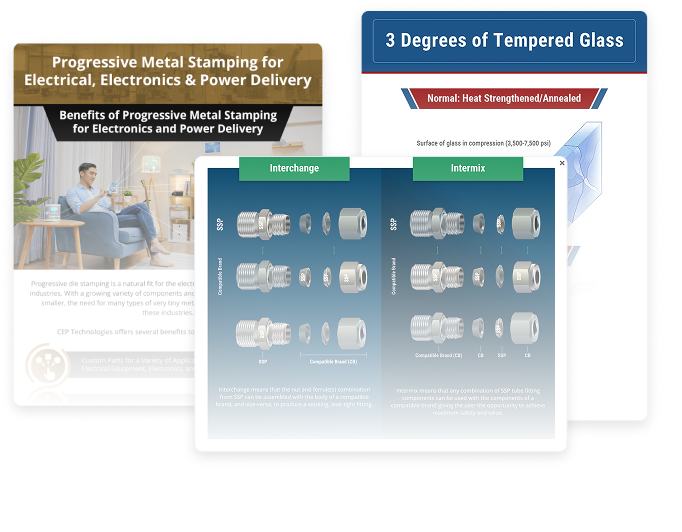
Static infographics still work well for content that needs a visual explanation but doesn't require input from the viewer, things like process flows, comparison charts, industry data, or step-by-step breakdowns. We design these as standalone assets that hold up on their own: shareable on social media, embeddable in blog content, and useful in a sales deck without extra context.
Formats We Build
Static formats we build include:
- Process and workflow diagrams
- Data visualizations built from industry research, Thomasnet insights, or client-supplied data
- Comparison graphics for materials, specs, or methods
- Industry statistics and trend summaries
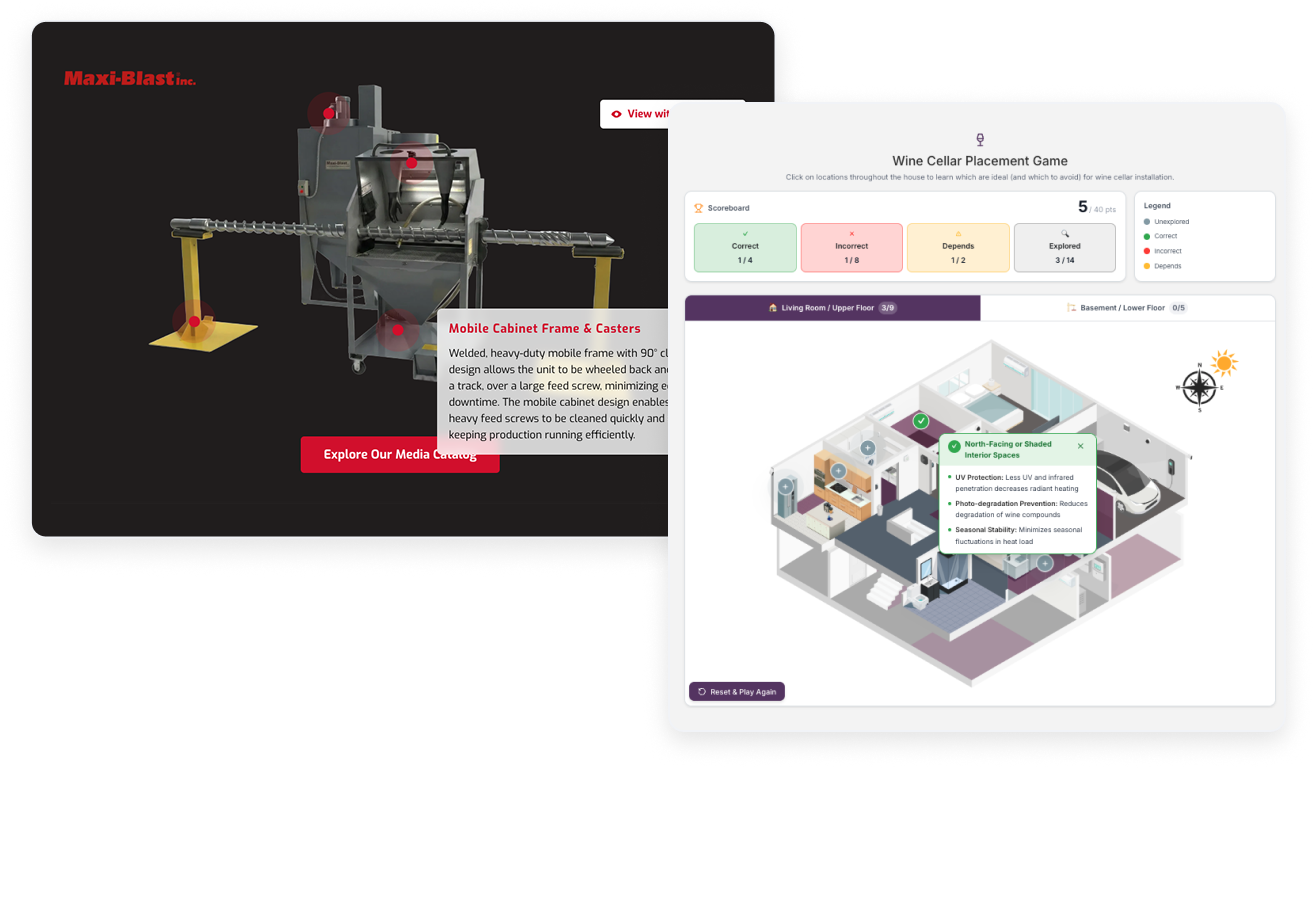
An interactive infographic takes the same subject matter and puts the viewer in control. They can filter data, switch between views, or step through a sequence instead of taking in one static image. For a technical audience doing their own research before ever talking to a salesperson, that control matters. One IIG can serve someone doing a quick comparison and someone doing a detailed technical evaluation, without needing two separate assets.
Why It Holds Attention Longer
That flexibility is also why IIGs tend to hold attention longer than a static graphic. More time on the page means more opportunity to capture that visitor's information or move them toward the next step.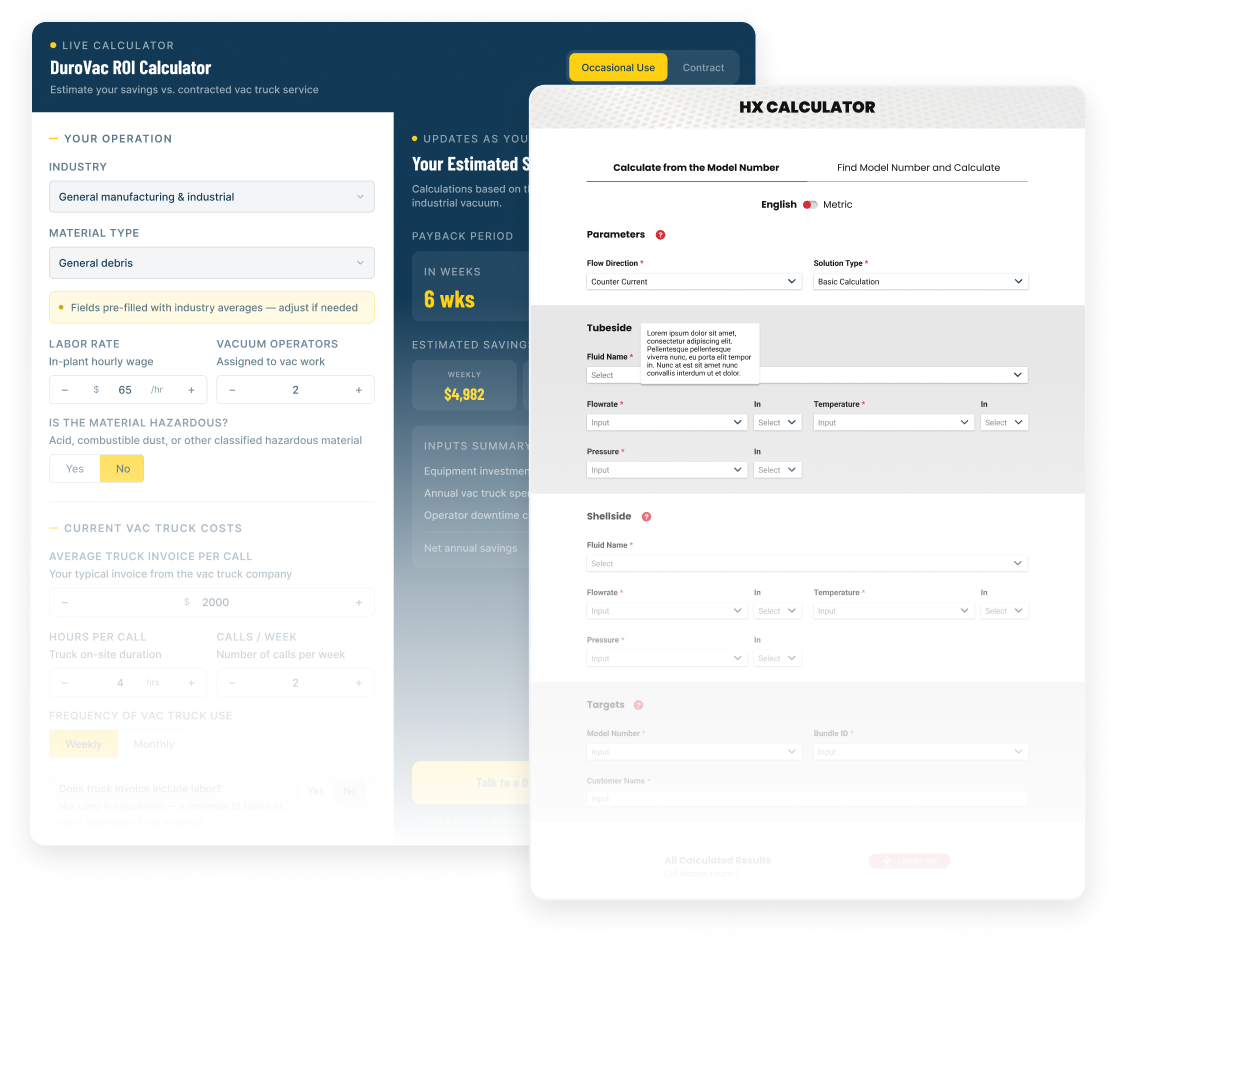
We build calculators and product selection tools under the same interactive category, but we treat them differently from a typical content piece. A calculator isn't decoration, it's a functional tool that helps an engineer or buyer solve a real problem: sizing a component, checking a spec against their application, or narrowing down a catalog to what actually fits.
Why This Is More Than a Content Upgrade
That distinction is what makes these tools valuable in two ways. First, a visitor using a tool to do their own work stays on the page longer than a visitor reading content. Second, someone who just calculated their exact spec requirements is a warmer lead than someone who read a blog post, this is a natural point to capture contact information.
Tools We Build
- Sizing and specification calculators
- Product selection and configuration tools
- Cost or ROI estimators
- Comparison tools that filter by technical parameter